As I mentioned in an earlier post, the primary motivation for our trip to San Dieigo was the
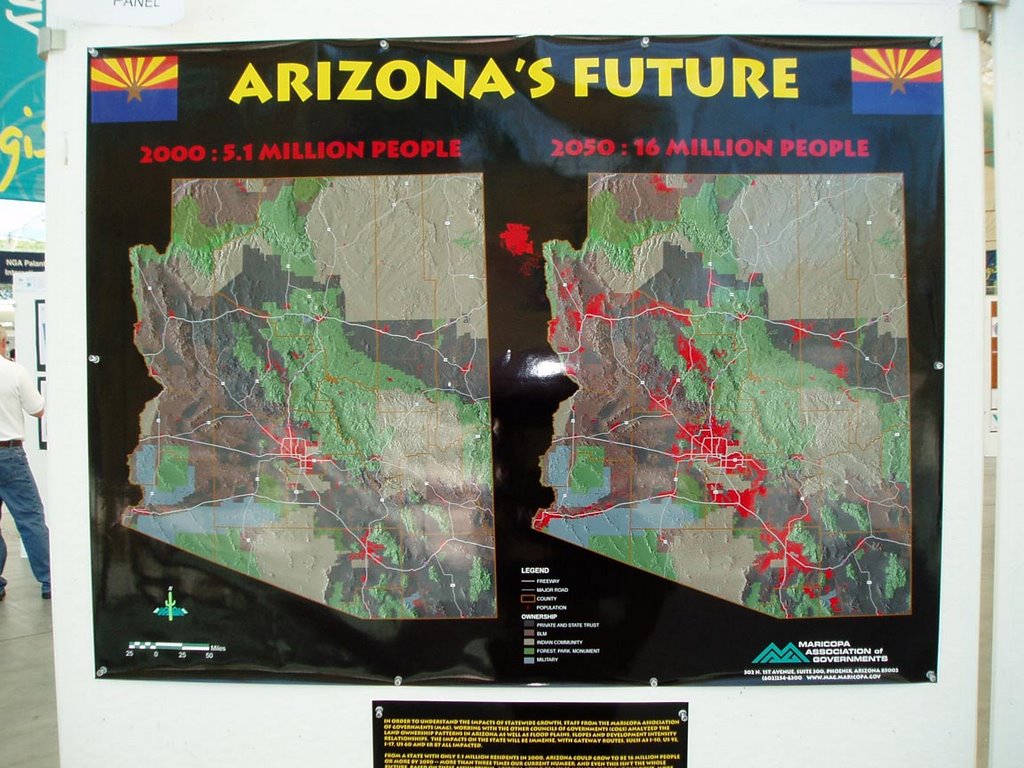
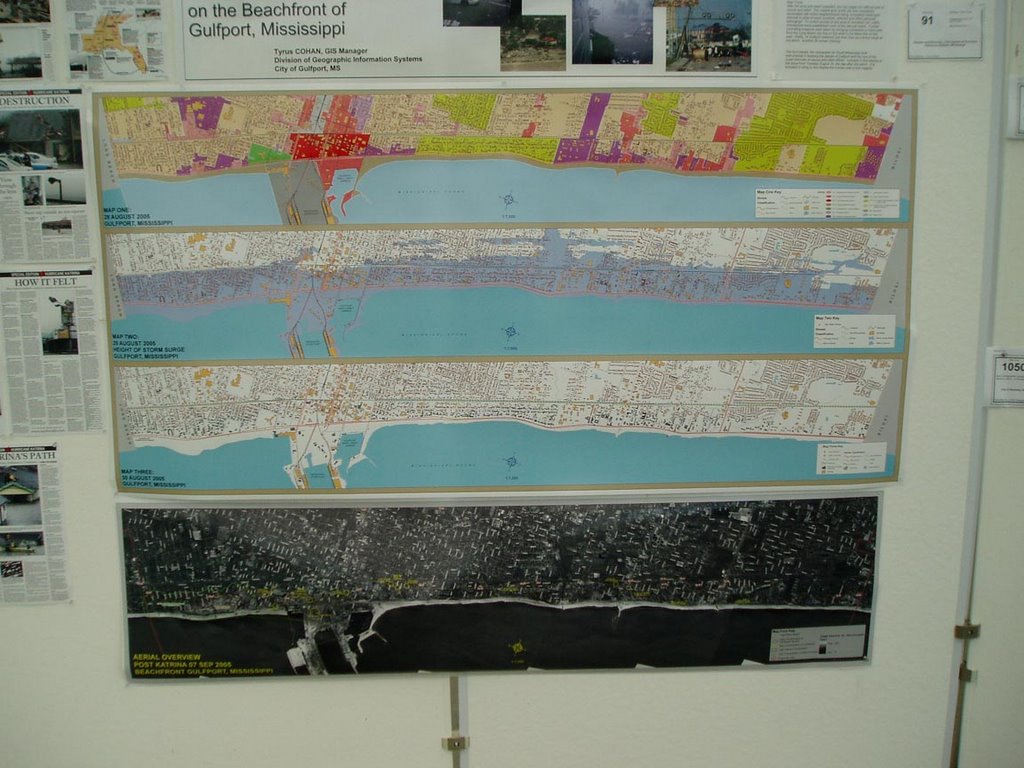
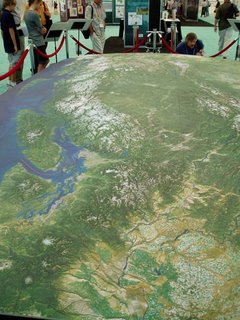
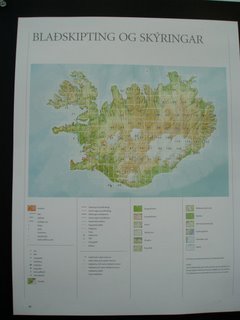
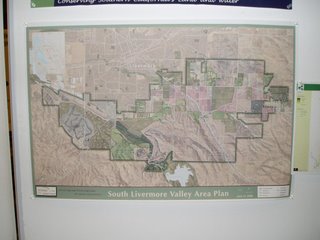
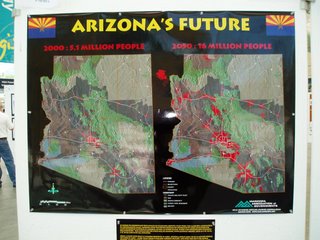
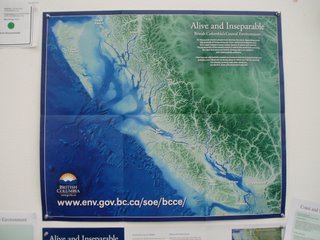
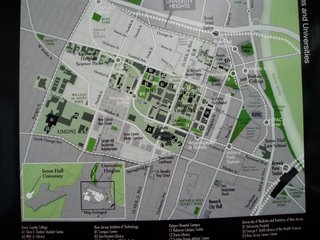
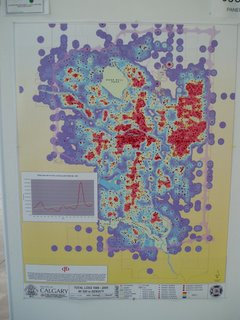
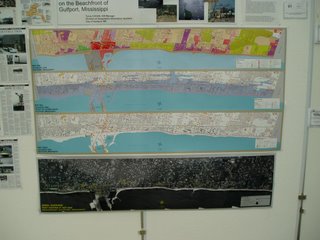
ESRI International Use Conference, which is put on annually by the maker of the most commonly used commercial GIS software, ArcGIS. I use ArcGIS almost every day at CommEn Space and have been using ESRI products in some form or another for 10 years. The conference was great fun. I always learn new things and gain great inspiration from the Map Gallery. This year was no exception. There were several outstanding sessions, which I describe in some detail below for any readers who happen to be similarly interested in spatial data and analyttical methods, and I'm also including some digital pics of a few of the maps I found particularly intriguing.
Here's a brief rundown on the sessions I attended. Please pardon the rough nature of the notes, most of them were hammered out on my laptop in real time.
Status of NLCD NLCD has two other products in addition to the landcover--percent impervious and percent tree canopy. The USGS has been using See5 for the classifcation tree; it is highly automated and will enable easily automated updates of national land cover. The canopy cover data set is complete for lower 48; moving on to AK next . Imperviousness is also done for most of the US
For landcover, by end of 2006 most of the lower 48 will be done
Download data here:
gisdata.usgs.net/website/MRLC
www.mrlc.gov
Spatial techniques for Marine Reserve selection Brian FulfrostAilinginae island--several uninhabited coral attols
Rapid ecological assessment --30 field sites; terestrial bird surveys
Remote sensing on benthic habitat, bathymetry, and vegetatoin changes using quickbird imagery
35 dive sites; somewhat biased locations due to remoteness
Question is how to protect attols biodiversity
Coral
Fish
Birds
Rare species
Range extensions
Derived bathymetry from Quickbird (Daria Siciliano) and also derived benthic classifiation--apparently many papers written on her methods (speaker
NDVI vegetation change analysis
Methods used are: Kriging, regressions, MARXAN (simulated annealing algorithm)
Kiriging: interpolate species richness from sampled points; interpolation from the points, so the surfaces were not very useful because of low N; doesn't look into currents, suitable substrate for larval settlement, etc, also doesn't incorporate ecological barriers (but Constantine @ ESRI has worked out some ways around that)
Regressions: N is too small, so regression has no significance
MARXAN: combines field data w/remote sensing.
1. Planning units
2. Conservation targets
3. Boundary length modifier (looks at adjacency issues)
Used hexagons across the islands
Targets:
Looked at sum irreplaceability--any poly chosen more than 50% of the time represent irreplaceable areas
Best fit model gives you the best output to meet your conservation targets.
MARXAN is not an "ecologically intelligent" tool, it's a decision making tool.
Combine techniques to get the best fit
The influence of Topography on Habitat Area Estimates Duane J. Haselfeld PSOMAS--consulting firm in CA
Basic idea here is there is, in some instatnces, a huge discrepancy between plannimetric area and topographic area
The relative increase in the topographic area is directly proportional to the slope--the steeper a place is, the less accurate area measurements will be
At 60 degrees, the error is approx 100%; the error is very low where slope is low, but it increases rapidly--
0-25 degrees, 10% error
25-40 degrees, 30% error
40-60 degrees, 100% error
Emphasizes that elevation is not a surrogate for slope.
Pretty interesting; bottom line is that when area calculations are important, use the topographic area and not the planimetric area
New Landcover Data for the State of Maine Sanborn office in San Diego
Andrew Lewis worked on the landcover map of Maine
Mike Smith from State of Maine
Mike Palmer from Sanborn in the Ann Arbor office
Project is moving form a 30m to a 5m data layer
Collaborative effort with Maine
Integrated with Federal NLCD/CCAP 2001 projects
Modeling wildlife habitat
Water quality
Imperviousness
Broad level planning initiative
Lots of partners on the project--Federal, state agencies, some non-profit? (Woodlot Alternatives was employed as the field data gathering arm)
Deliverables: 5-meter landcover, based on the NLCD 2001 landcover data classes
5-meter imerviousness data for about 25% of Maine
Recylced a lot of work from the NLCD work
Used SPOT panchromatic; semi-automated approach to binary impervious
Resulting products are CCAP, 5m polygon based map (not as interdigitated landcover classes)
Ran image segmentation on SPOT 5 to get the landcover classes
USed E-cognition for segmentation
Used training data based on the change classes (I think on some field work too)
RFeferred to as a "low cost" option--but how much did it cost?
He mentioned that they're doing some stuff with 1m resolution data
$125k for the SPOT imagery
$100k for the analytical work
Pan sharpening was done in ERDAS Imagine
Energy Mapping in Austria Because of direct o indirect solar production, increasingly huge land areas are necessary for energy production. Energy will soon be readically impacting zoning throughout the developed world.
Demand indicators:
• Demographics
• Business data
• Using standardized load curves from utilities
1. Demand forecast
2. Potential Generation forecast: concept is a “virtual powerplant” of different types of renewables; transmission doesn’t’ send energy over long distance,s mostly provides stability to the entire network
3. Looking for a locally adapted mix of appropriate renewable energy sources
Look at segmentation for defining homogeneous regions froma grid—looks a bit like thiessen polys; “autoarkic regions”
Equitable Fee Collection Using Enhanced Impervious Surface Data Lauri Sohl, City of Sioux Falls All properties in SD are charged a storm drainage fee based upon impervious cover per parcel. Impervious surface includes roads, parking lots, etc
Parcel area X runoff WT factor X unit financial charge
Runoff factor is determined by land use, based on intensity of use
METHODS:
Orthophoto 6” resolution
Infrared IKONOS 4m
Resolution merge using Leica Geosystems Image Analysis Extension; used Borvey transformation, nearest neighbor resample
Feature Extraction by Visual Learning Systems (an extension)—VLS Feature Analyst
Create “learning” feature class.
Conservation Plan for Southeast Pennsylvania Clare Billet, Smart Conservation, smartconservation.org ***VERY INTERESTING presentation. Looked at terrestrial vertebrates, grid-based from GAP. For aquatic resources, used the watershed. For Terrestrial resources, used GAP and heritage for Rarity (how did they solve the absence of absence problem?)
Focused on top 20% as nodes
Used roads, railways, streams, waterbodies, as barriers for the network analysis
Web-site supports on-line digitizing, analyzes how important that site is, online—pretty amazing
Identifying, Defining, & Mapping Natural Infrastructure in SW Pennsylvania Andrew Schwartz, Environmental Planning & Design, LLC
Landscape Characterization & Evaluation of Alachua County FLPartnered with the Information Center for the Environment (ICE) @ UC Davis